Utilities
Module: utilities
- pytim.utilities.lap(show=False)[source]
Timer function
- Parameters:
show (bool) – (optional) print timer information to stderr
- pytim.utilities.correlate(a1, a2=None, _normalize=True)[source]
correlate data series using numpy fft. The function calculates correlation or cross-correlation.
- Parameters:
a1 (ndarray) – first data set to correlate
a2 (ndarray) – (optional) second data set, to compute the cross-correlation
- Example: time autocorrelation of the number of atoms in the outermost
layer
>>> import MDAnalysis as mda
>>> import pytim
>>> import numpy as np
>>> from pytim.datafiles import *
>>>
>>> u = mda.Universe(WATER_GRO,WATER_XTC)
>>> inter = pytim.ITIM(u)
>>>
>>> size=[]
>>> time=[]
>>> # sample the size of the first layer on the upper
>>> # side
>>> for ts in u.trajectory[:50]:
...     time.append(ts.time)
...     size.append(len(inter.layers[0,0]))
>>>
>>> # we need to subtract the average value
>>> np.set_printoptions(precision=3,threshold=1000)
>>> corr = pytim.utilities.correlate(size-np.mean(size))
>>> corr = corr/corr[0] # normalize to 1
>>> print (corr)
[ 1.     0.142  0.104  0.147  0.371  0.099  0.165  0.095  0.338  0.219
 -0.021  0.087  0.245 -0.01  -0.193  0.103  0.029 -0.009 -0.11   0.012
 -0.133  0.056 -0.283 -0.276  0.035 -0.012 -0.211 -0.429 -0.132 -0.263
  0.072 -0.7   -0.236  0.136 -0.243 -0.878 -0.13  -0.329 -0.386 -0.652
 -0.267 -0.188 -0.226 -0.79  -0.284 -0.02  -1.512 -1.316 -0.188  7.551]
>>> np.set_printoptions()
This will produce (sampling the whole trajectory), the following:
(
Source code,png,hires.png,pdf)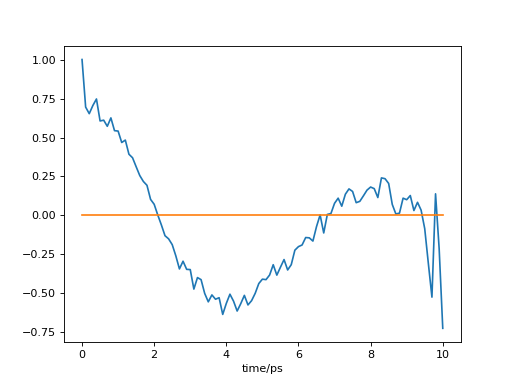
- pytim.utilities.generate_cube_vertices(box, delta=0.0, jitter=False, dim=3)[source]
Generate points at the vertices of a rectangular box
- Parameters:
box (array_like) – dimensions of the box
delta (array_like) – add buffer around the box
jitter (bool) – create general linear positions by minute displacements of the vertices
dim (int) – dimension of the rectangular box, the default is 3